








Electrical inspections need to identify anomalies and show how connection temperatures change during operation. Visual checks establish equipment and site conditions, while infrared thermography locates surface hotspots. Handheld RFID inspection reads multiple installed sensing points in one scan, and fixed continuous temperature monitoring tracks changes between rounds. Matching each tool to its task helps turn findings into maintenance action.
Start with two questions: do you need surface heat patterns or temperatures at specific connections? And do you need readings during inspection rounds or ongoing data? Manual inspection is a way of working. Both thermal cameras and handheld RFID readers can be part of it, but they collect different information through different processes.
Using terminals, busbar joints and circuit breaker contacts inside switchgear as examples, this article explains how the four approaches share the work and how readings and images support on-site checks and maintenance follow-up.
From site checks to ongoing tracking: how the four approaches work together
Visual checks provide clues about equipment and its surroundings. Thermal imaging searches observable areas for hotspots. Handheld RFID collects readings from multiple connections along an inspection route, while fixed monitoring follows points that need ongoing attention. The table compares their tasks, records and deployment conditions.
| Approach | Main task | Time coverage and records | Access or installation conditions |
|---|---|---|---|
| Visual and on-site inspection | Check visible condition, indicators and changes around equipment | Checklists, photographs and observations from each visit | Limited by safe access; visual checks do not directly measure connection temperature |
| Handheld infrared thermography | Search observable surfaces and compare nearby heat patterns | Thermal images and measurement conditions at inspection time | Requires a suitable infrared viewing path; emissivity, reflections and load matter |
| Handheld RFID inspection | Read multiple installed sensing points in one scan | Readings during rounds; sensor IDs link records to equipment | Install sensors first; read within effective RF range without visually locating or aiming at each sensor |
| Fixed continuous temperature monitoring | Track selected connections during operation | Data at the configured collection interval; trends and alerts depend on configuration | Sensors with nearby antennas and a reader; plan power and data connections |
Thermal imaging locates surface hotspots
Infrared thermography shows heat patterns on observable surfaces, helping personnel identify areas for further inspection and see whether heat extends to adjacent conductors.
The key to interpreting a thermal image is knowing which surface the camera sees. A cabinet door, cover or insulation surface does not directly represent the connection temperature beneath it. Metal emissivity and reflections also affect readings. When using an infrared window, check the areas it covers and the measurement settings. Thermal images provide surface and surrounding context; concealed connections require a suitable way to measure their temperature.
Record the inspection time and load with each thermal image for later comparison. The same location can show different results at low and high loads, so a normal image on one visit still calls for ongoing follow-up.
Handheld RFID reads multiple connections in one scan
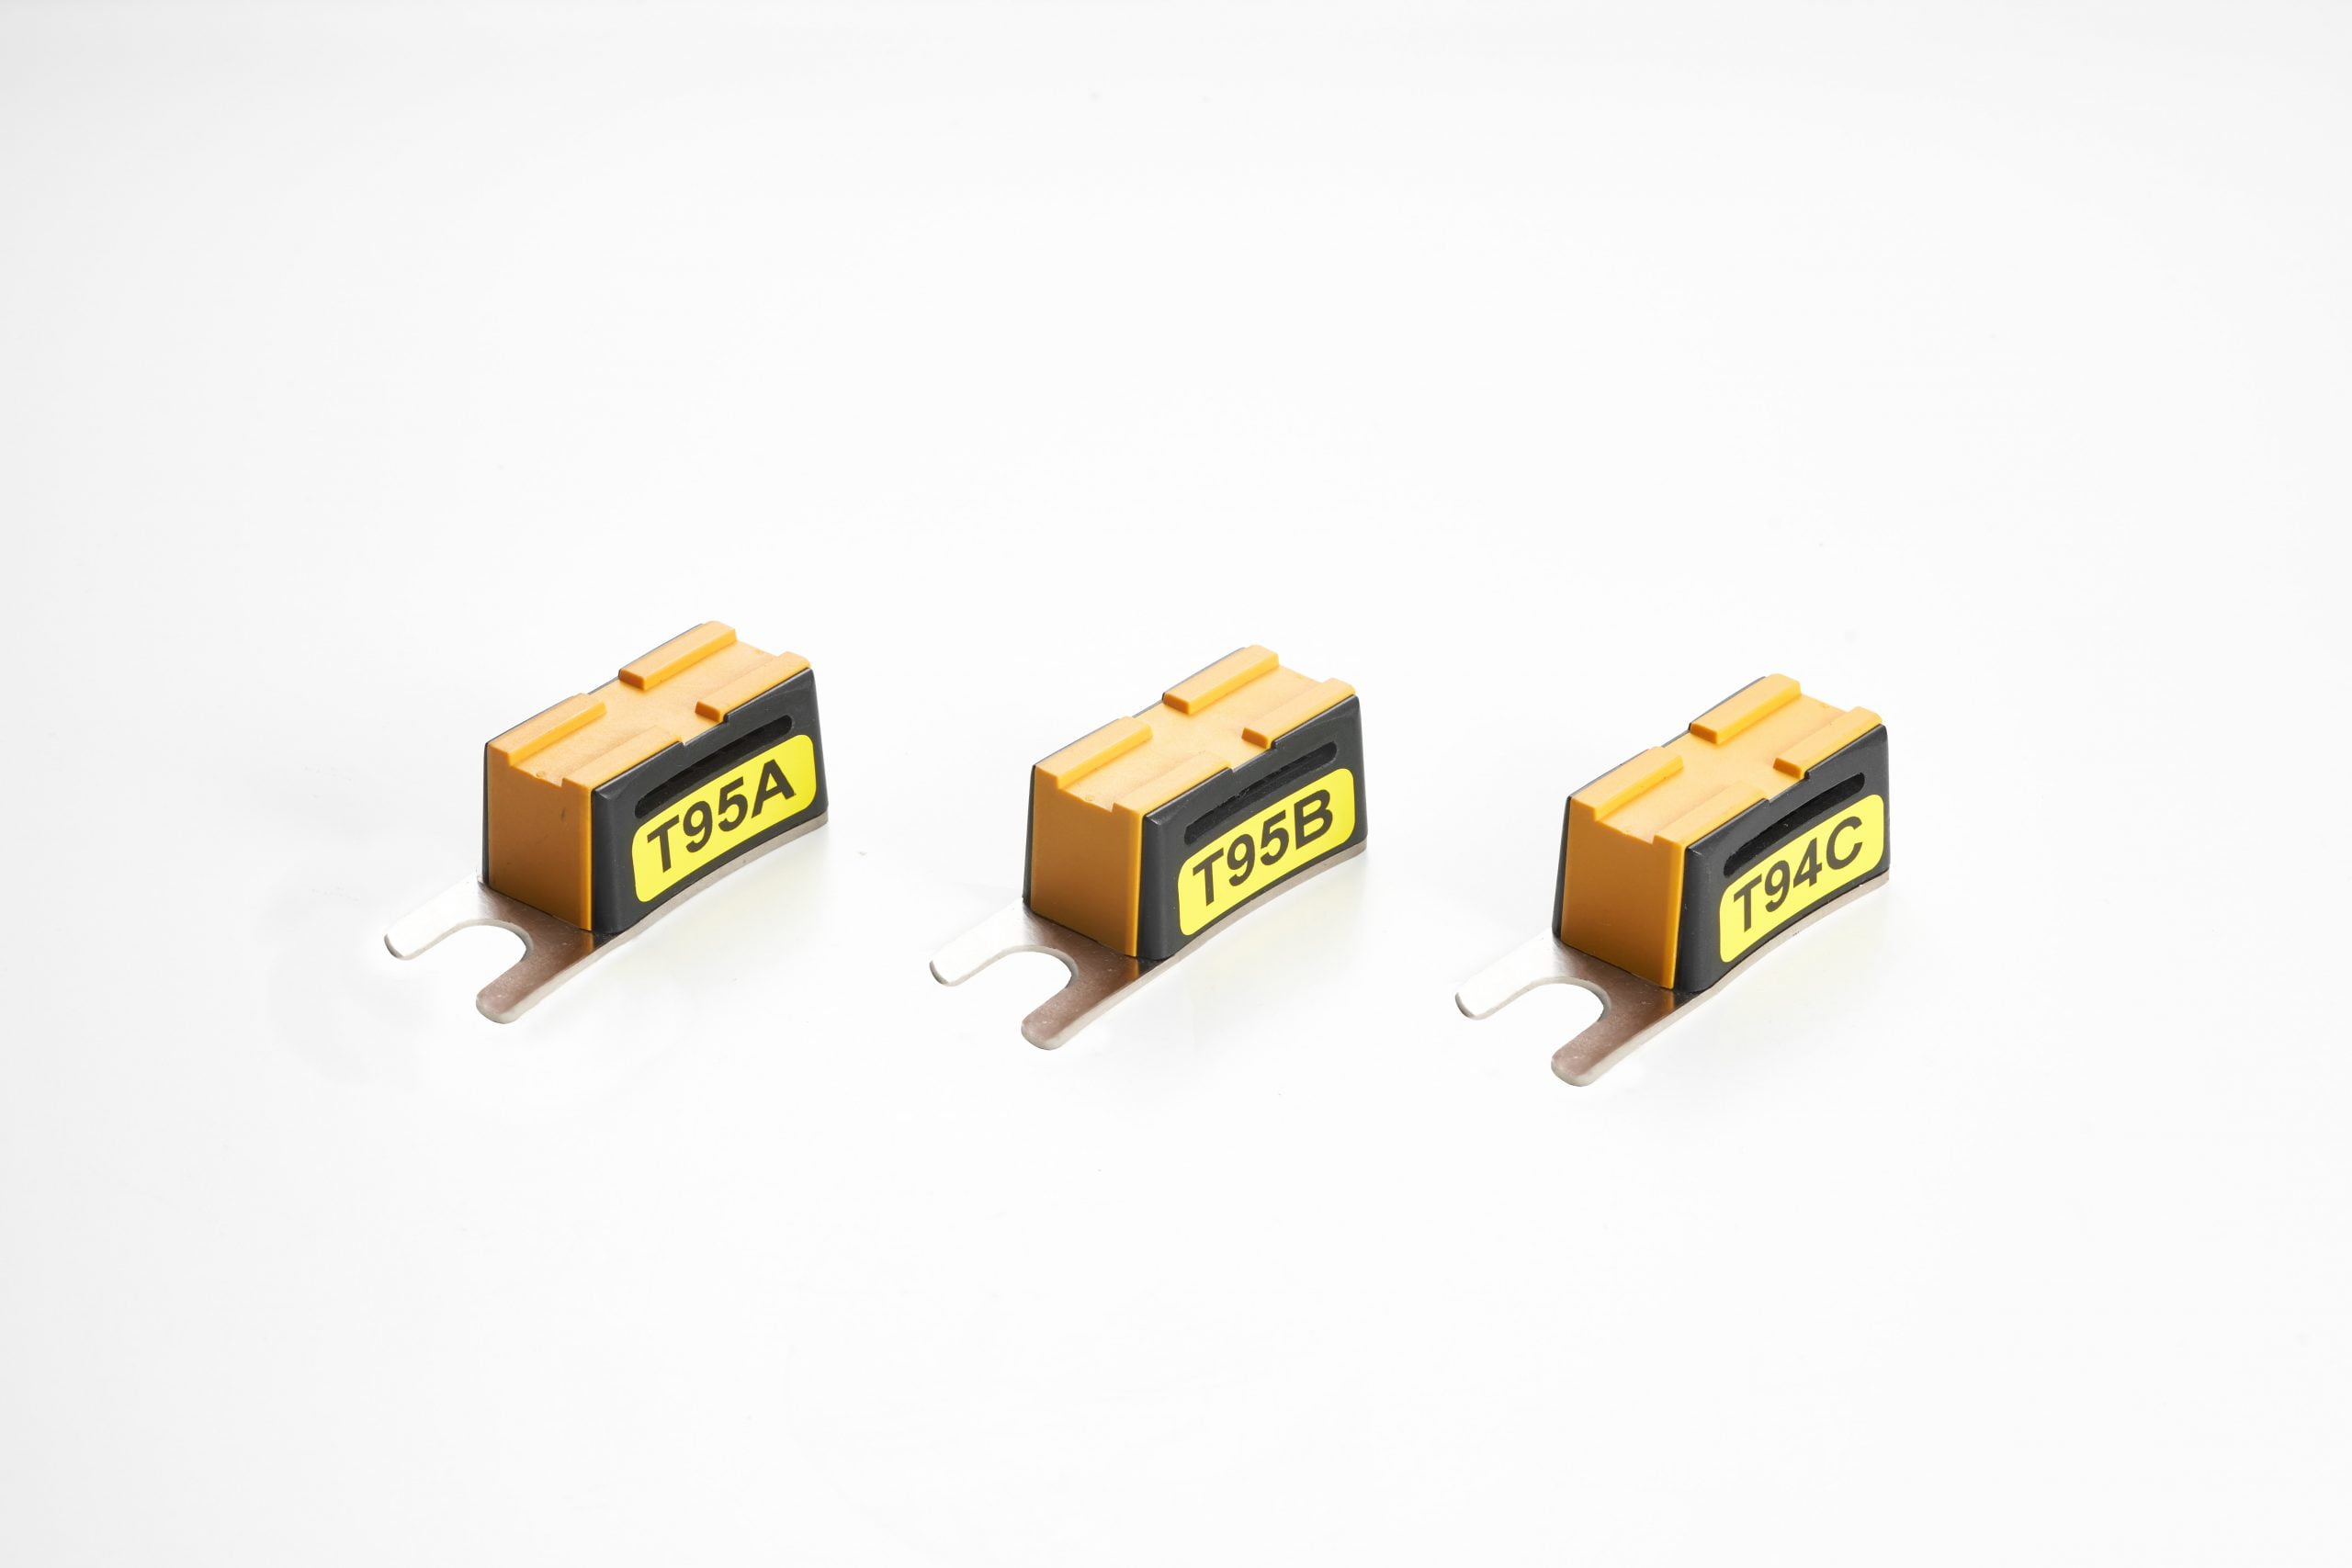
When inspections focus on a defined set of connections, RFID sensors can be installed at those locations and scanned within effective reading range to collect temperatures from multiple points at once. Readings do not depend on thermal images or require personnel to see or aim at each sensor. This helps with concealed connections and reduces repetitive work across many sensing points.
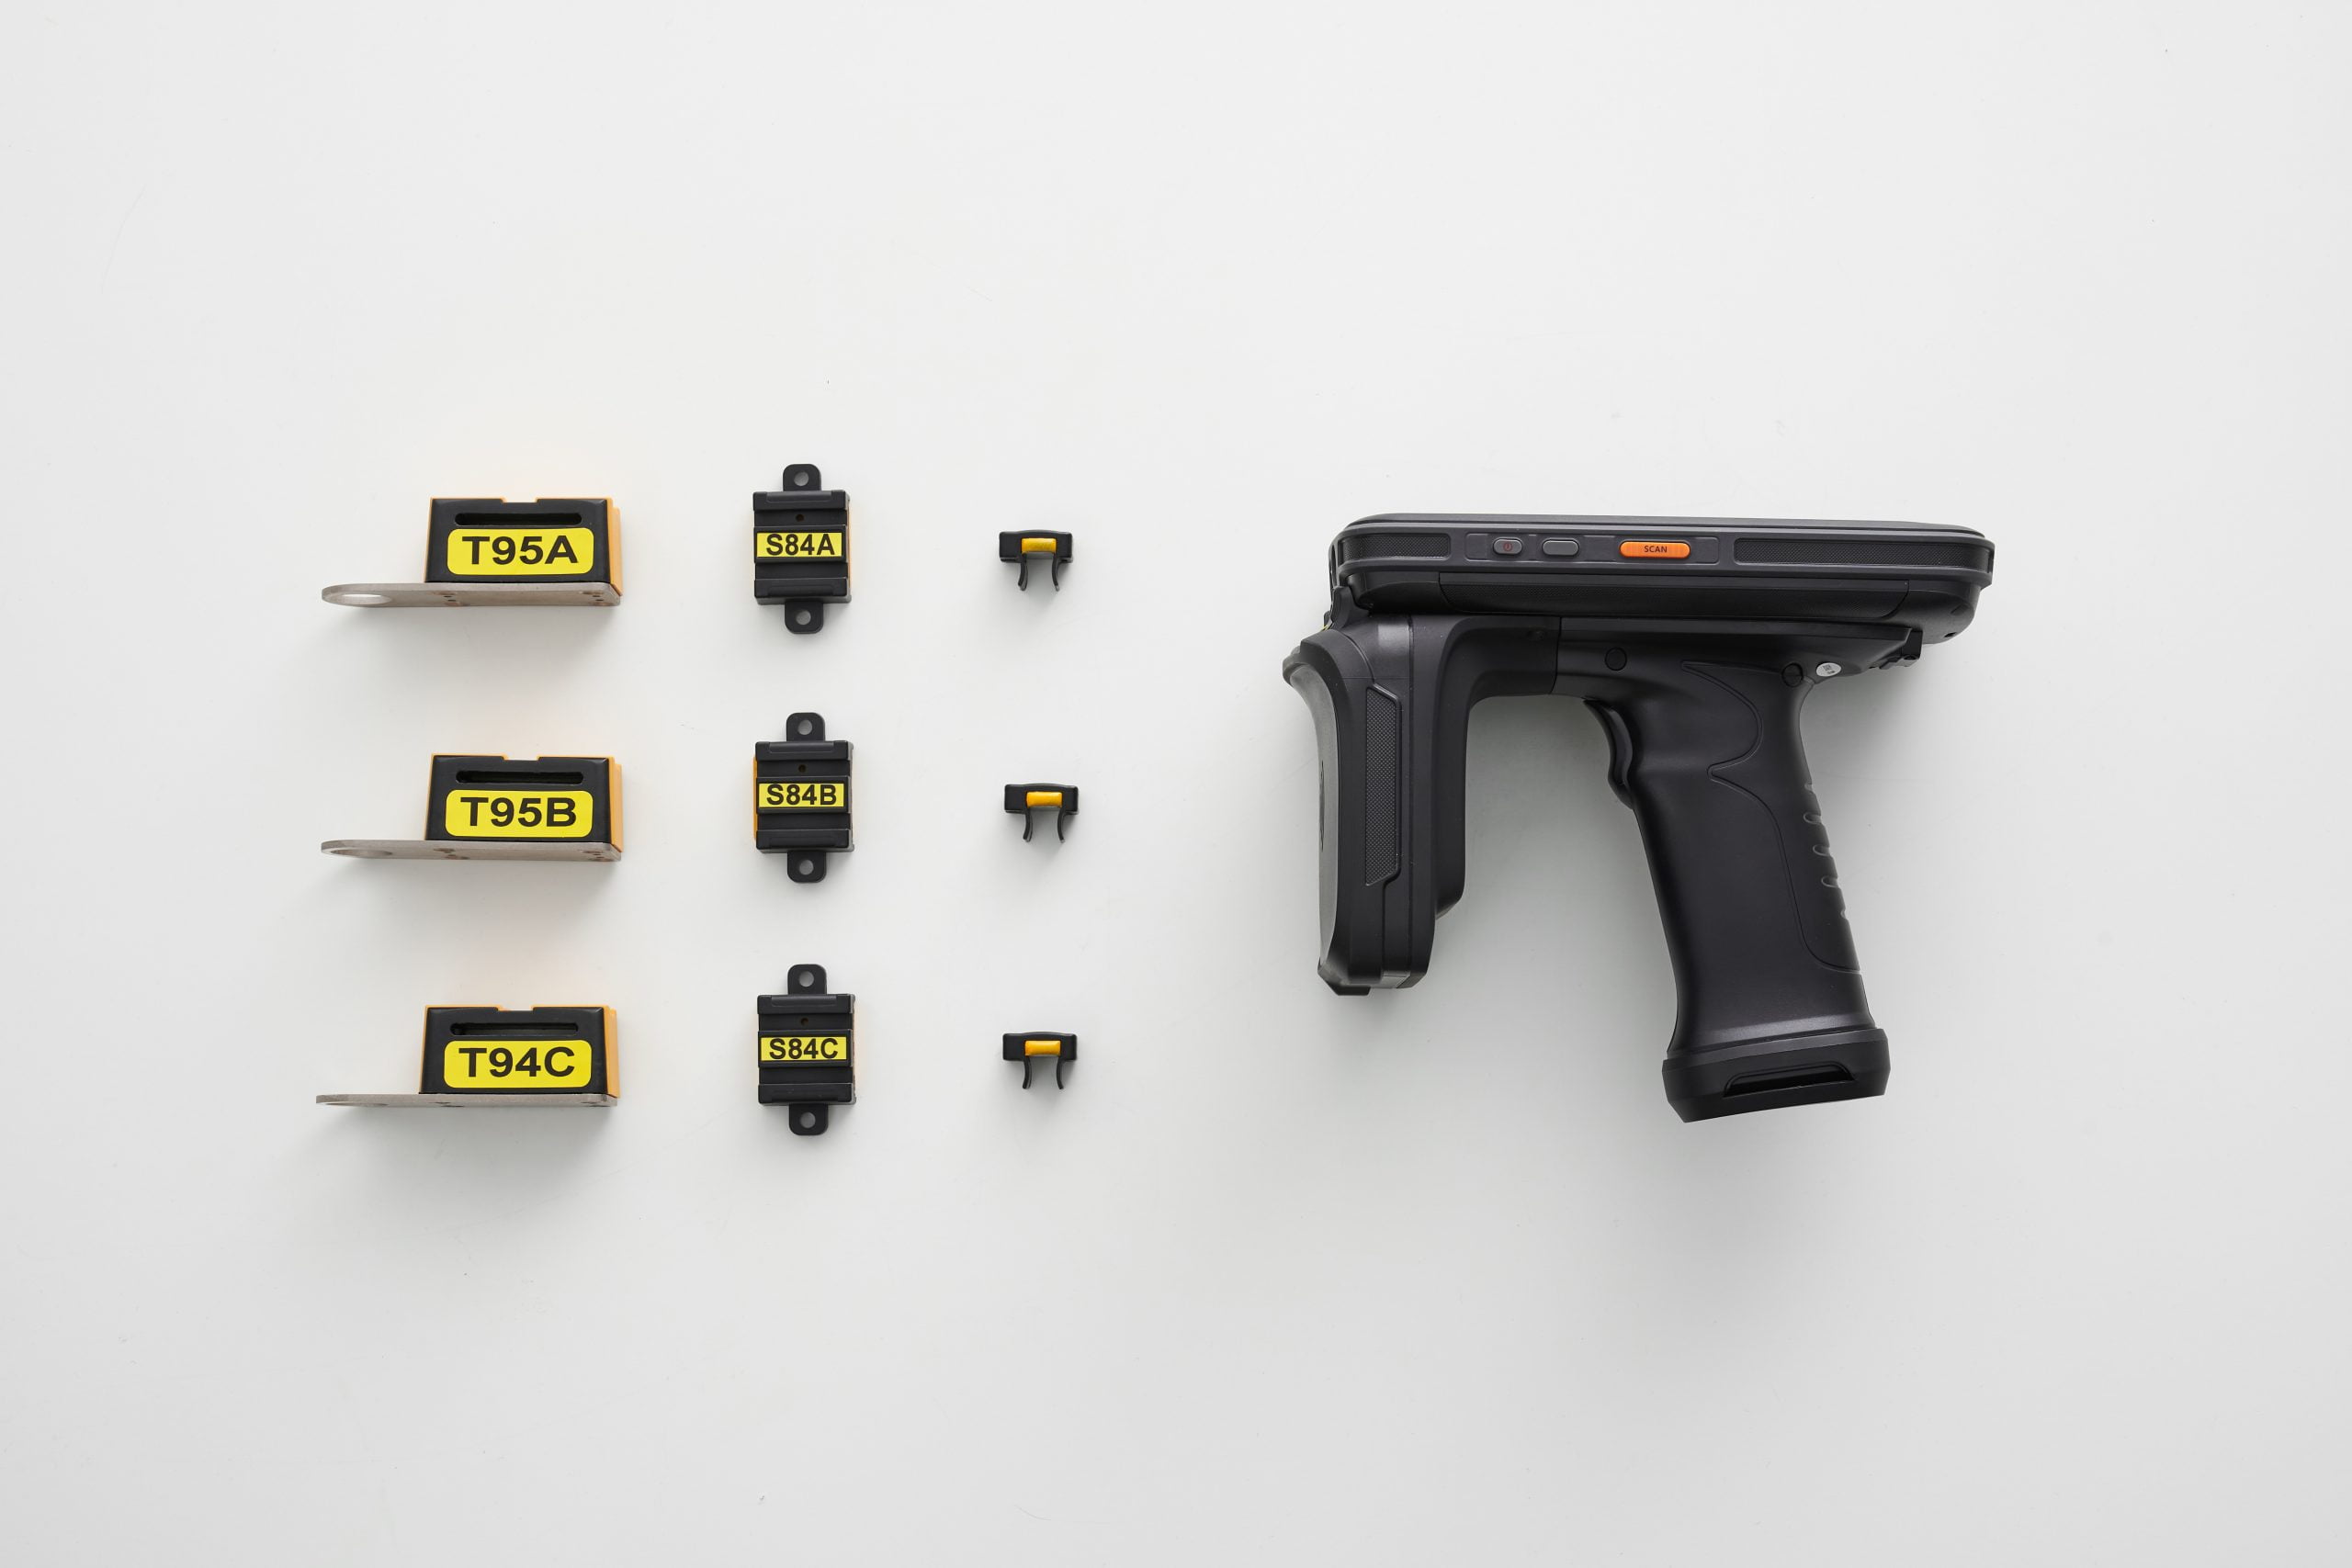
In the PQSense handheld solution, sensor IDs link readings to equipment and sensing points. The app displays and records readings, reducing manual transcription and subsequent data organization. RFID collects data from installed sensing points, while infrared thermography shows surface heat patterns. Together, they support connection tracking and wider hotspot searches.
Fixed monitoring tracks changes between inspection rounds
Handheld RFID reduces the work involved in collecting and recording readings, but the data still comes from scans taken during visits. If connections heat up at night, under high load or during particular production periods, fixed continuous temperature monitoring collects data at configured intervals. Trends and alerts help maintenance teams track changes and schedule checks.
For example, a connection may read normally during a visit yet heat up repeatedly during peak production. Ongoing records help identify those periods for comparison with load and site conditions. Even before equipment has overheated, records of everyday temperature changes provide a reference for detecting later anomalies and comparing conditions after maintenance.
Fixed monitoring covers installed sensing points, while visual checks and thermal imaging can continue to inspect other locations and environmental changes. Teams should also check collection and communication status to confirm that records remain up to date and useful for daily decisions.
Connect inspection findings to investigation and maintenance follow-up
Records from different tools should refer to the same equipment and connection. Cabinet identifiers, sensing-point names and timestamps link inspection records, thermal images and temperature trends, allowing teams to follow four steps:
- Detect and locate: Use visual findings, thermal images, handheld RFID readings or fixed-system alerts to identify equipment that needs attention, then confirm the cabinet and connection location.
- Compare conditions: Check the time, load and previous records. Before comparing thermal images with sensor readings, confirm that they describe the same location.
- Investigate and act: Qualified personnel assess the cause and response timing using on-site findings and equipment importance, then arrange the necessary maintenance under the applicable procedures.
- Follow up: Recheck under comparable operating conditions. Review the same sensing point and surrounding heat patterns, recording improvements and any recurrence.
RFID sensor IDs can be mapped to equipment and sensing-point names, reducing the work needed to identify locations again and transcribe readings. Adding site findings, maintenance actions and follow-up results lets the next team continue tracking the same issue.
PQSense Passive Wireless RFID Temperature Monitoring Solutions
PQSense uses battery-free sensors to measure connection temperatures through handheld inspection or fixed monitoring configurations. Multi-point scanning and digital records reduce repetitive tasks during existing inspection rounds. For equipment that needs ongoing attention, fixed monitoring builds temperature histories to help teams schedule checks earlier.
Handheld inspection: Personnel scan installed sensors along their inspection route, collecting temperatures from multiple points in one scan and using the app to view and record the results.
Recommended reading: PQSense Handheld Temperature Monitoring System
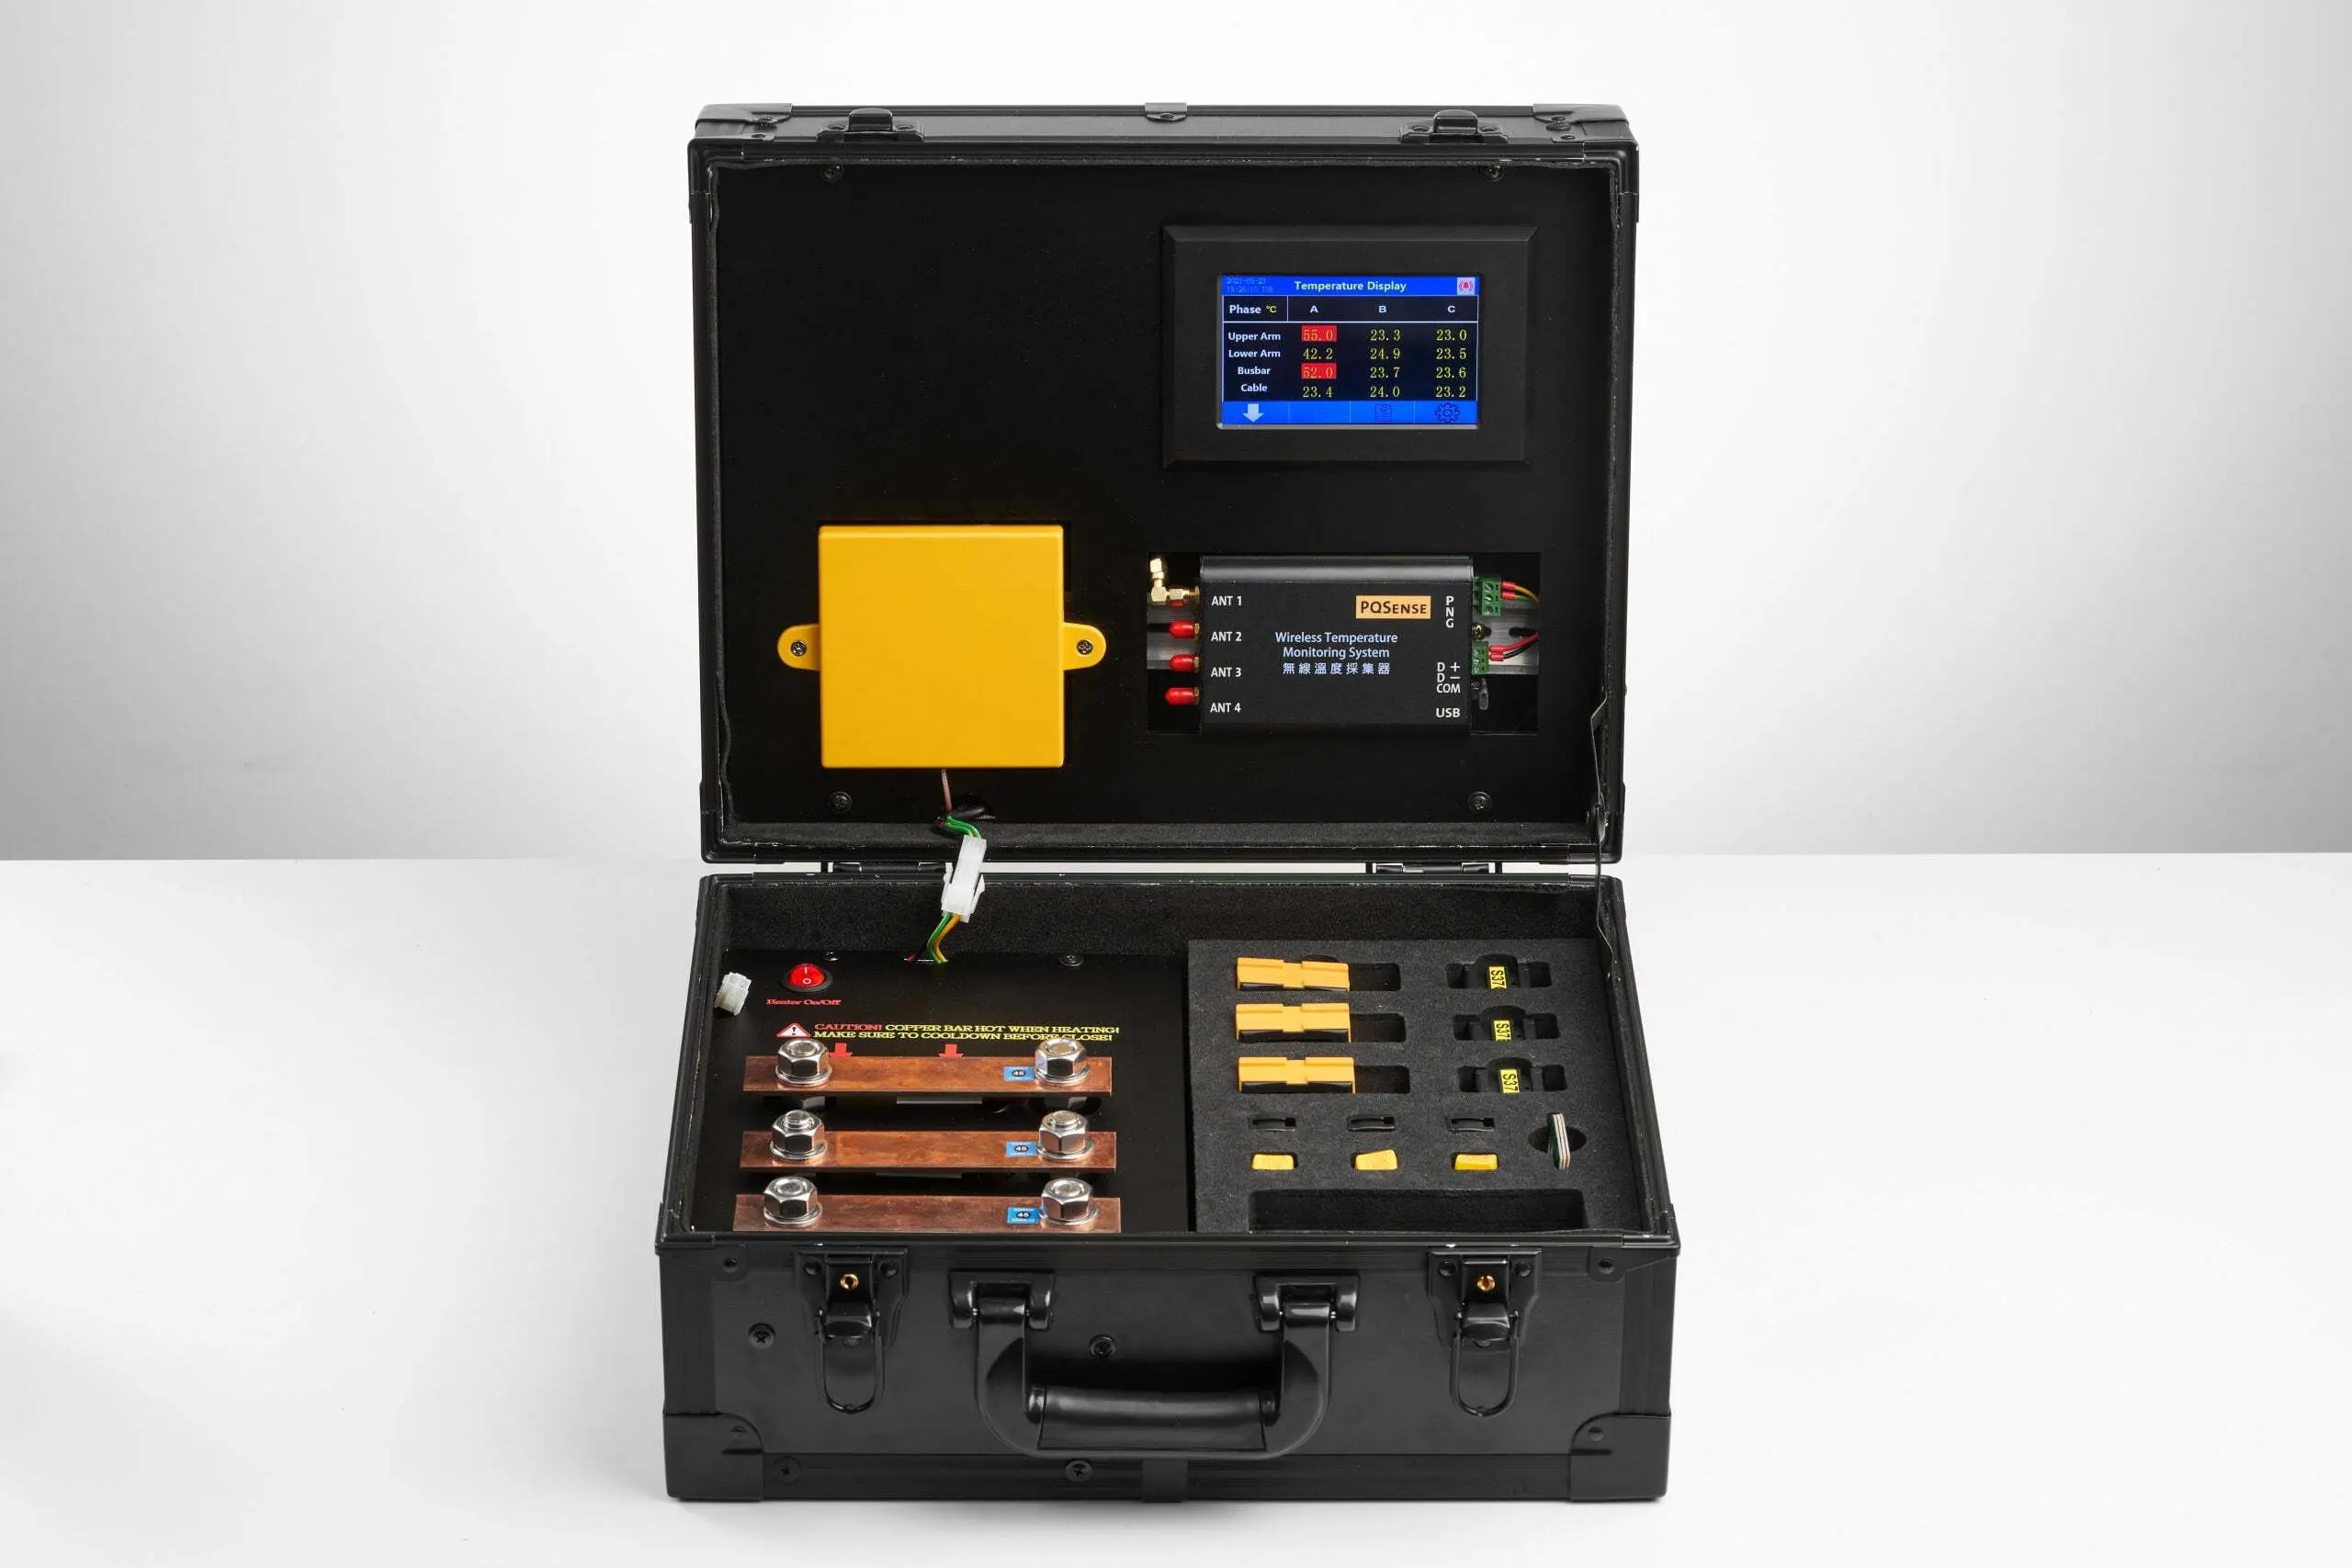
Fixed monitoring: Antennas and a fixed temperature reader collect connection temperatures on an ongoing basis, with local displays, historical trends and alerts available according to the configuration.
Recommended reading: How to Choose the Right Wireless Temperature Monitoring System
Contact us to discuss your inspection process, target connections and data collection needs.
FAQ
Can handheld RFID read every sensing point inside a cabinet?
It can read installed sensors within effective RF range. Cabinet construction, metal shielding and the configuration affect that range. PQSense helps assess suitable sensing points and reading positions.
What advantages do RFID sensors offer for monitoring connections inside switchgear?
RFID temperature sensors are installed at the connections of interest and measure temperature at those locations directly. They avoid relying on thermal images of doors, covers or nearby surfaces to infer connection conditions, making them useful for tracking locations that are difficult to observe directly. Infrared thermography adds surrounding heat patterns to help locate other hotspots.
Can handheld RFID inspection be converted directly to fixed monitoring?
To track connection temperatures outside inspection rounds, use a PQSense fixed monitoring solution. Temperature records, trends and alerts help teams schedule checks earlier and follow up on maintenance outcomes.
PQSense helps assess suitable sensing points and configurations so fixed monitoring complements existing inspection routines.
What should an inspection record contain?
At a minimum, record equipment and sensing-point names, timestamps, readings or thermal images, load information and observations. RFID systems help identify sensing points and save readings; personnel add site findings, maintenance actions and follow-up results to provide a basis for comparison on the next visit.