





Infrared thermography shows the temperature distribution of observable surfaces within its field of view and is effective for finding surface hot spots. What it cannot capture includes connections behind closed panel doors or other obstructions, and conditions outside the inspection period, including higher-load periods.
Blind Spot 1: No Line of Sight with Panel Doors Closed
Infrared measurement relies on infrared radiation reaching the camera lens. In data center power distribution equipment, several common locations may therefore be inaccessible to measurement:
- Busbar joints, bolts and breaker contacts behind closed doors or enclosures
- Connections within drawout or compartmentalized structures
- Cable terminals hidden by insulating boots, barriers or cable ducts
- The rear or wall-facing side of equipment where a suitable viewing position is unavailable
Imaging these locations requires opening a door or using a viewing window. Whether a door may be opened for measurement depends on the site's safety assessment and procedures. Without a viewing window, opportunities to obtain an internal view are usually more limited.
Blind Spot 2: Inspection Intervals Create Gaps in Time
Periodic inspections sample equipment condition at discrete times. Heating caused by insufficient contact pressure or deteriorated contact surfaces develops through load changes and repeated operation, including between inspections.
This can result in two situations:
- The equipment appears normal during inspection, although elevated temperatures have occurred in the intervening period.
- Temperatures have been rising gradually, but each inspection reading remains within an acceptable range. The trend is harder to identify without historical data from the same point under similar loading.
More frequent inspections can reduce the sampling interval, but do not remove the other constraints: doors remain closed, work authorization still needs to be arranged, and higher frequency may increase labor requirements.
Blind Spot 3: The Measurement May Not Be Taken at Peak Load
Heating due to contact resistance changes with current. The same connection may have substantially different temperatures at half load and full load, so the load at the time matters when interpreting a reading.
Several data center load characteristics can amplify this problem:
- AI training and batch workloads can draw substantially different amounts of power at different times.
- In some redundant architectures, backup paths carry little load until a transfer places a larger load on them.
- Rack expansion is phased, so the current carried by the same panel changes between quarters.
An inspection during a lower-load period will generally show lower temperatures. Comparing records from different times requires similar loading; otherwise, the difference cannot be attributed confidently to contact condition or current.
Data Center Operating Conditions Affect Inspection Planning
The constraints on infrared inspection in a data center differ from those in a general industrial facility:
| Operating condition | Effect on inspection |
|---|---|
| Access control and escort requirements | Entry times are restricted; outside personnel need escorts and registration |
| Authorization for energized work and opening panels | An internal view requires prior authorization and safety measures and may not be available at every inspection |
| Two-person work and protective equipment | More personnel are needed for an inspection |
| Service continuity requirements | Outage windows are harder to obtain, concentrating work into limited opportunities |
| Equipment count and zoning | Many panels at one site limit the coverage achievable in a single inspection |
| Record processing | Images must be interpreted, matched to equipment IDs and filed; the time required is often underestimated |
Estimate total person-hours by adding each participant's preparation, on-site work and record-processing time across all inspections. Access rules, panel counts and staffing vary considerably between sites, so use actual site records rather than generic figures.
What Data Does Each Method Provide?
| Method | Measurement target | Line of sight required? | Time coverage | Main use |
|---|---|---|---|---|
| Infrared thermography | Temperature distribution of observable surfaces within the field of view | Yes | At the time of inspection | Find surface hot spots and verify known anomalies |
| Handheld RFID reading | Connections with installed sensors | No direct view of the sensor required | At the time of inspection | Read multiple points in one scan, identify locations by sensor ID and record readings |
| Fixed continuous monitoring | Connections with installed sensors | No direct view of the sensor required | Continuous | Track changes between inspections and establish comparable trends |
Infrared thermography remains useful for finding previously unknown surface hot spots and verifying anomalies. Connection sensors provide readings at specified locations.
PQSense Passive Wireless RFID Temperature Monitoring
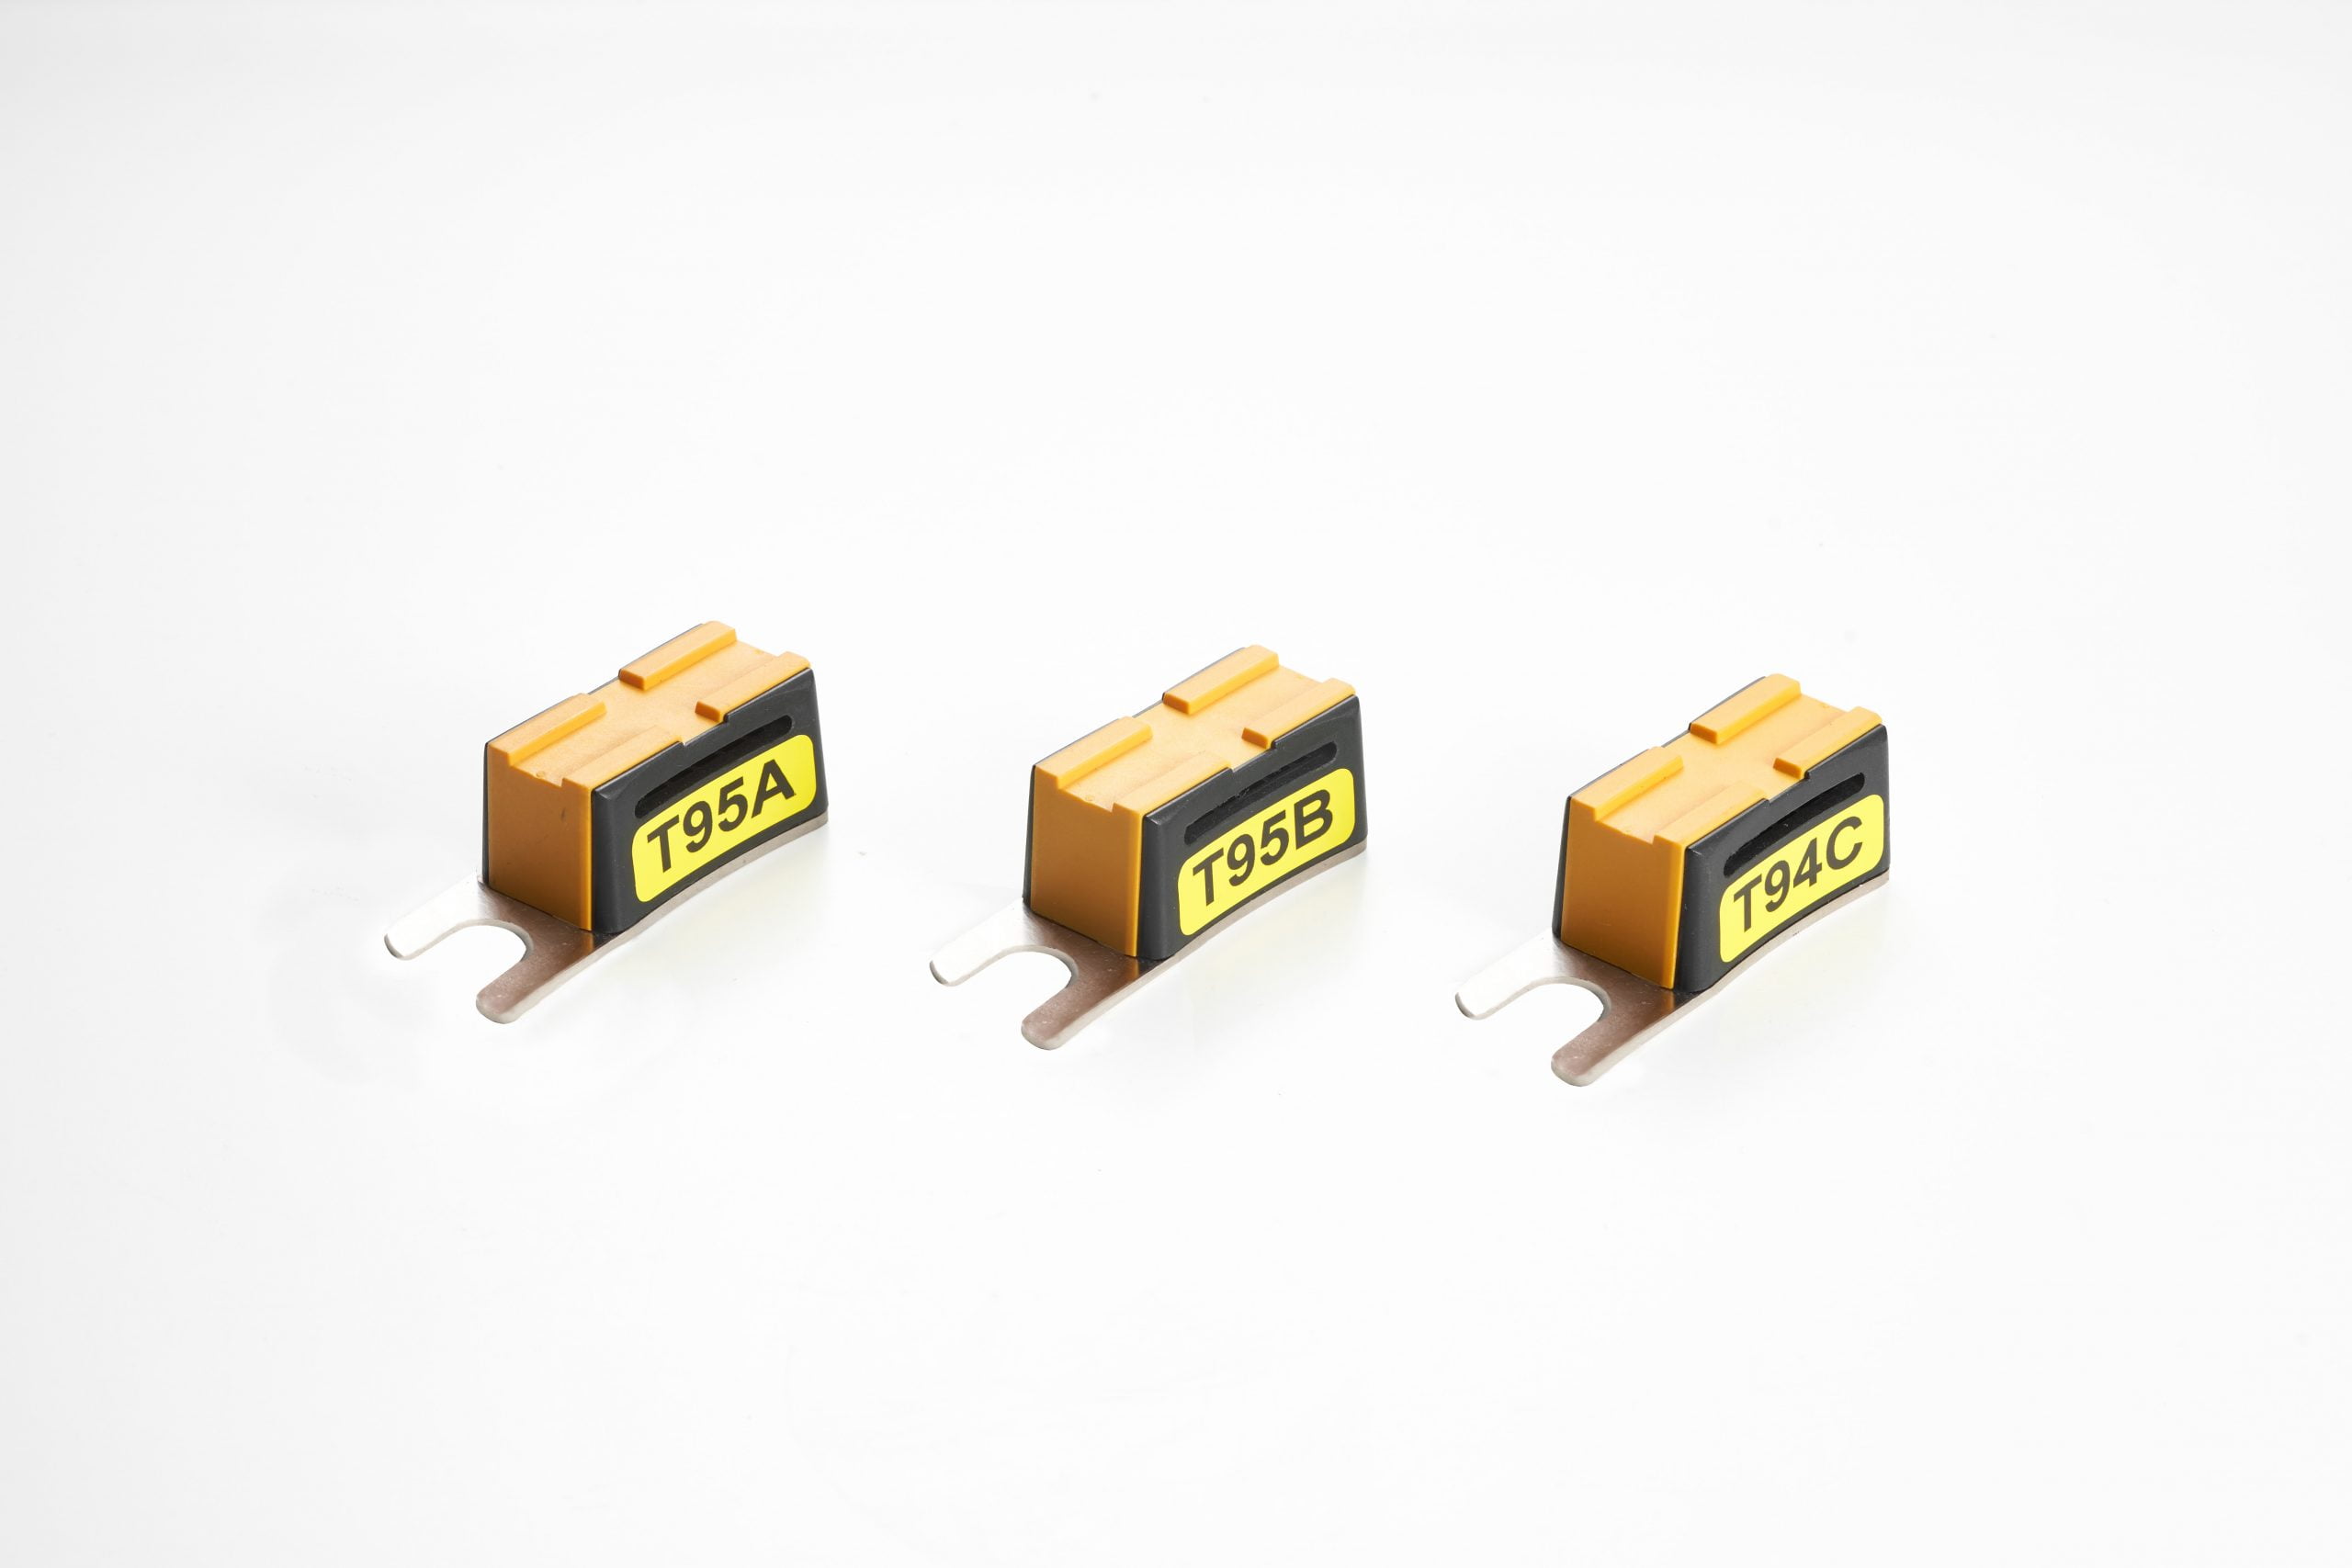
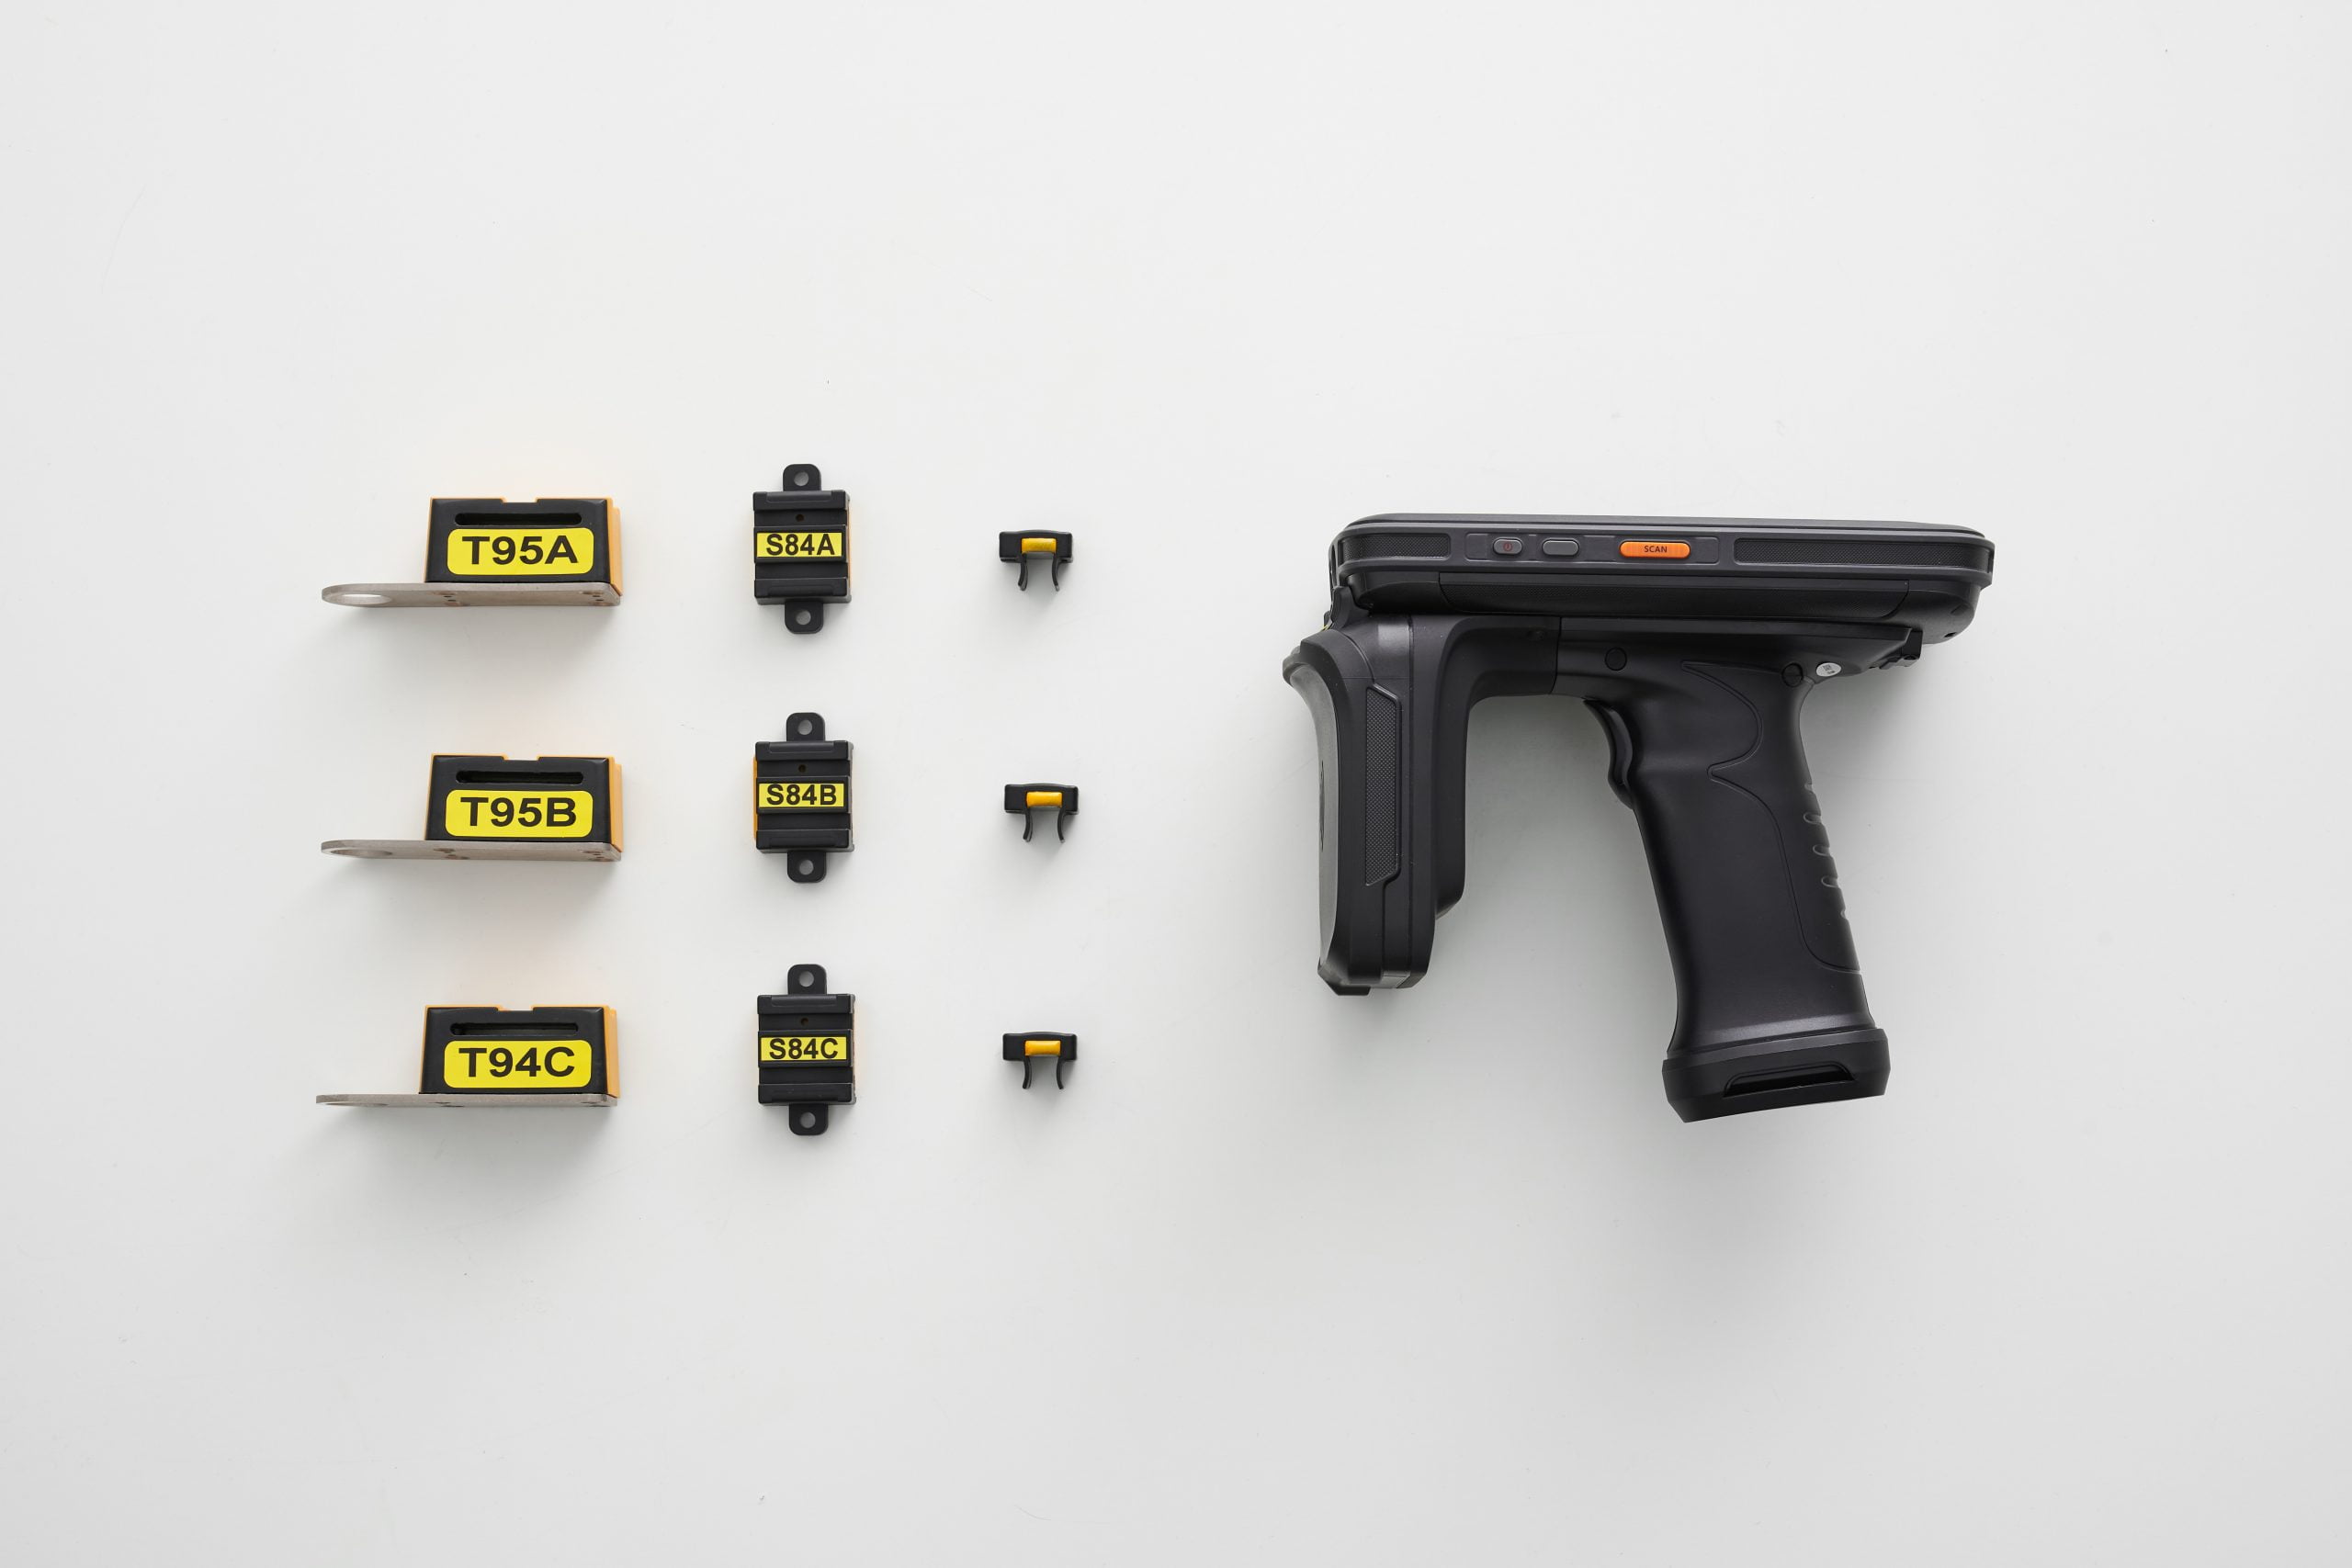
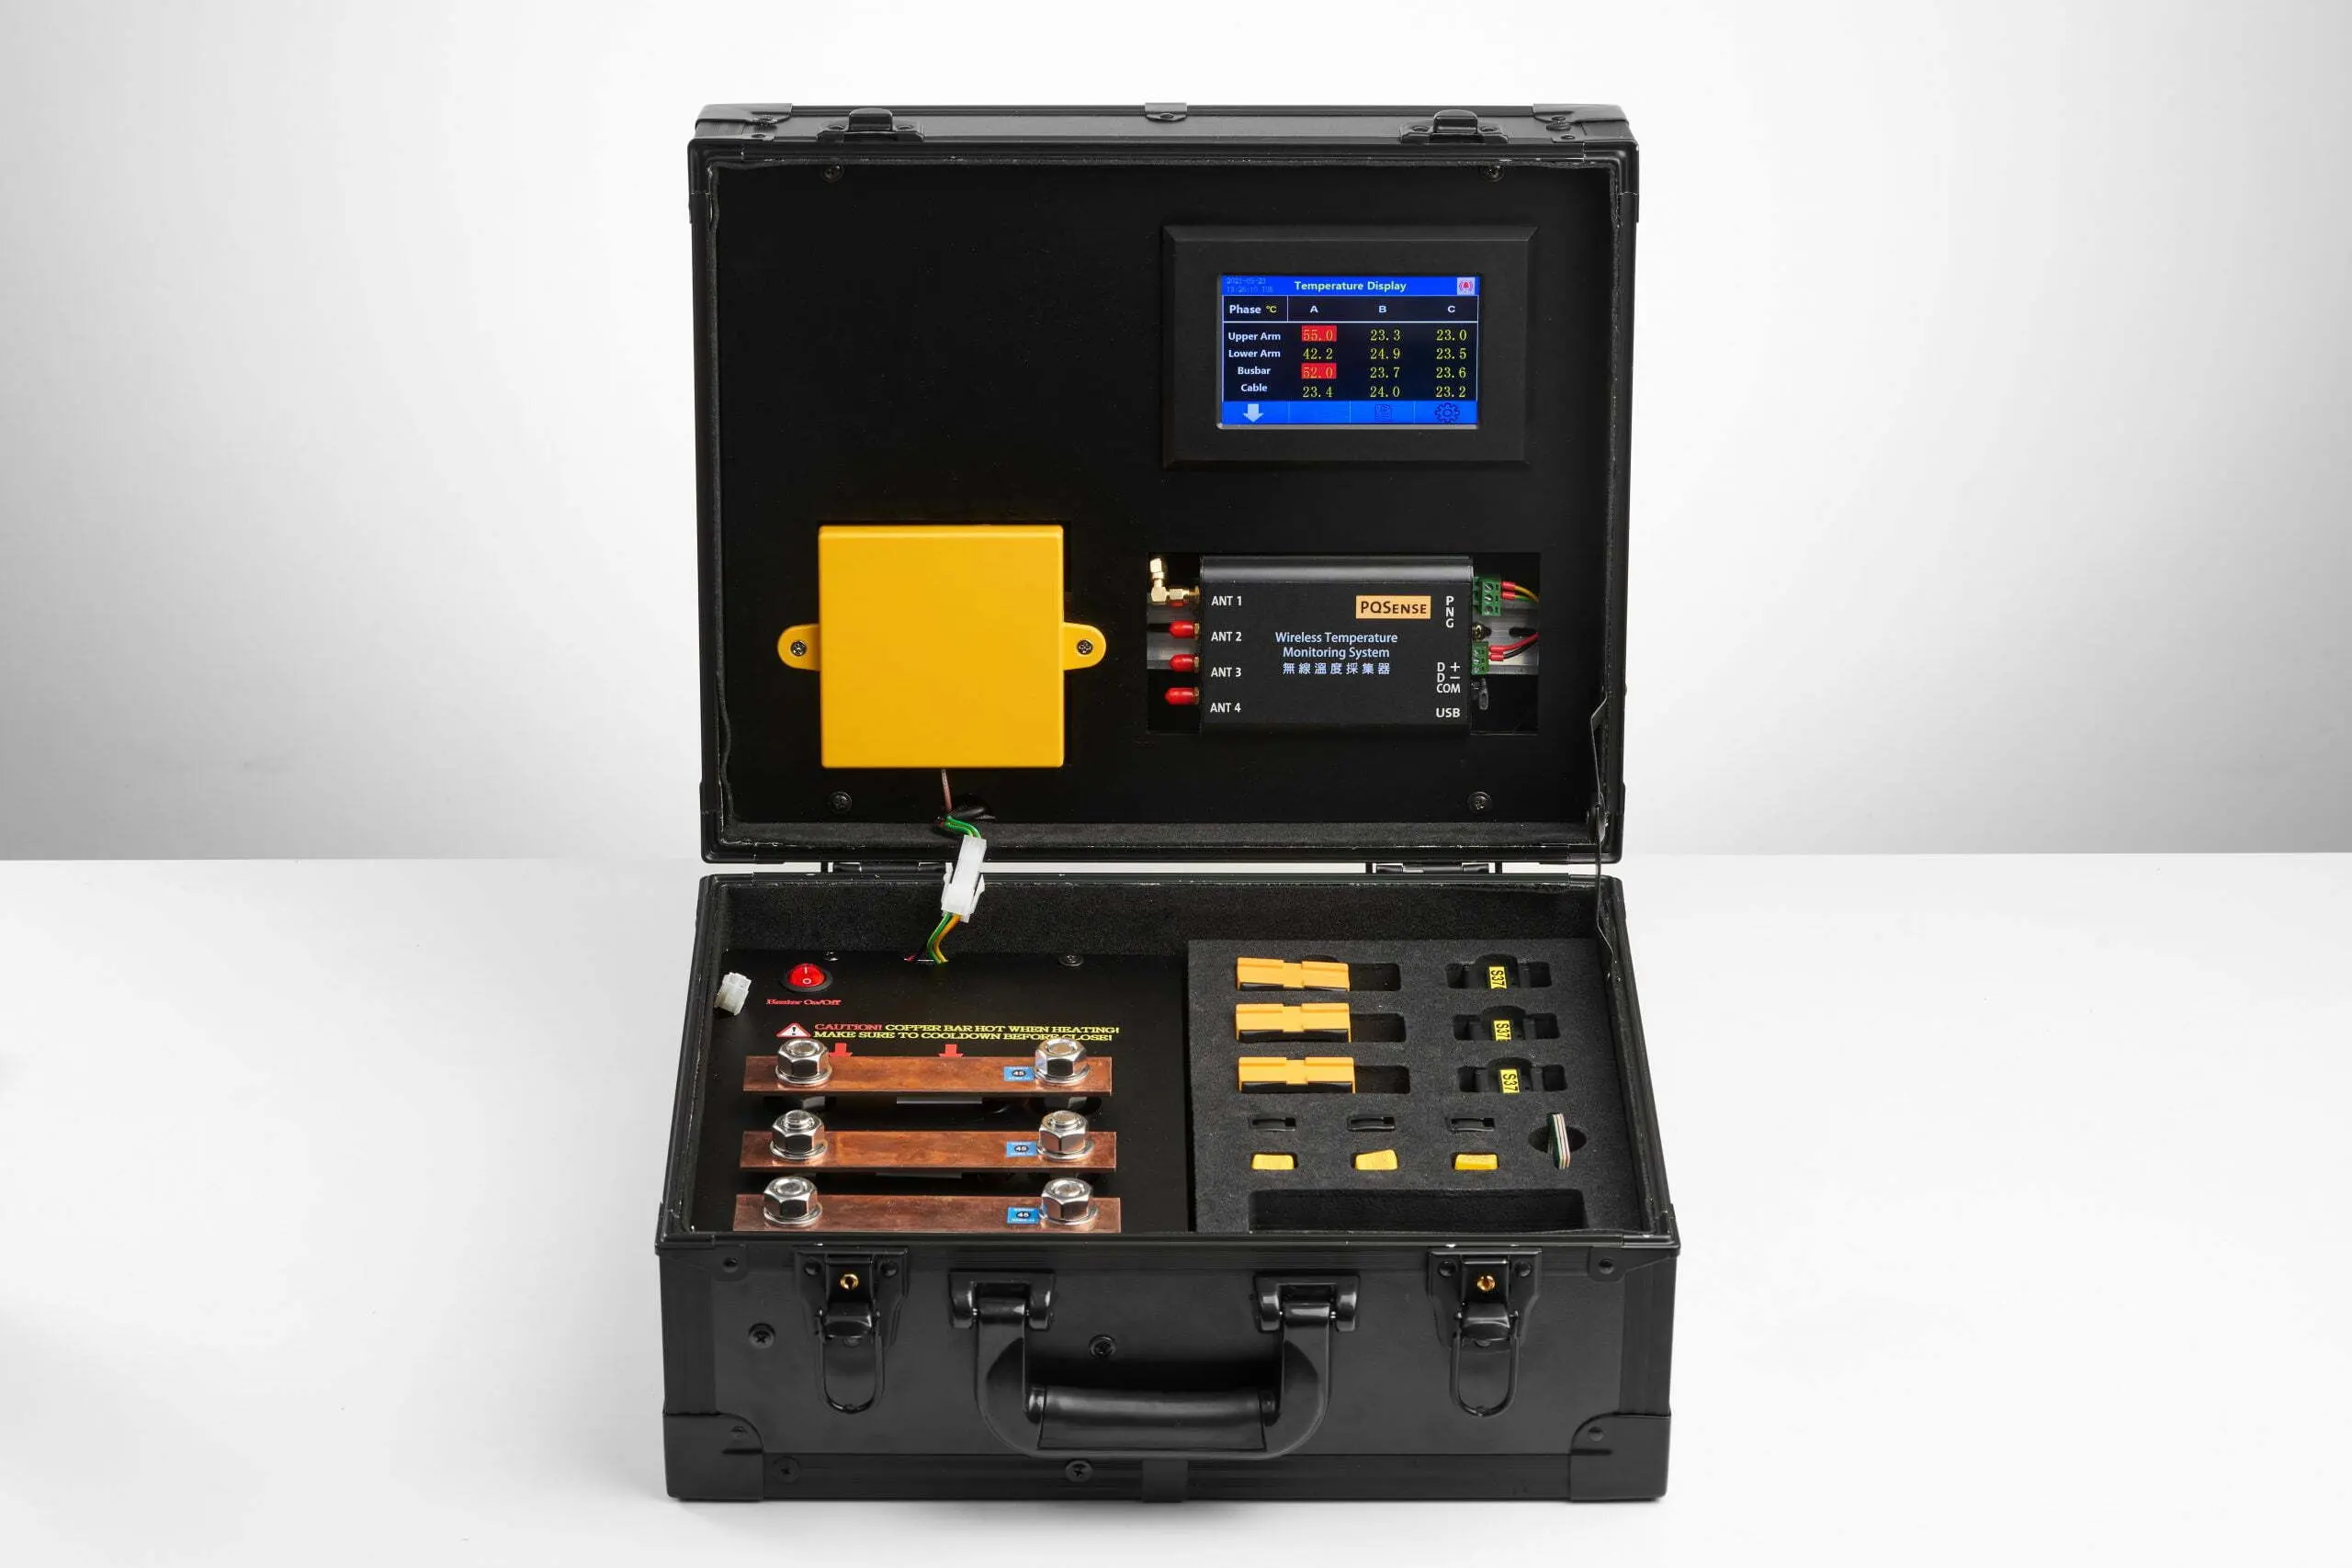
PQSense provides battery-free RFID temperature sensors, fixed temperature readers and handheld readers for monitoring specified locations in power distribution equipment. Sensor installation requires an outage. Once installation is complete and the equipment is re-energized, a fixed system can provide continuous monitoring. The target is the connection itself, rather than the outside of a panel or nearby air. Reading with doors closed depends on antenna position, RF configuration and installation conditions. This addresses visibility constraints; it does not mean signals penetrate any metal enclosure or can be read at any distance.
Suitable deployment locations depend on the connection type. PQSense product information lists the corresponding sensor designs.
Where continuous data is not needed, a handheld reader can read installed sensors within the effective range without aiming at each point individually. Readings are recorded together with sensor IDs.
Contact us to discuss existing inspection coverage and equipment that needs continuous data.
FAQ
Is Infrared Thermography Still Needed with Continuous Monitoring?
Yes. Continuous monitoring covers only points with installed sensors, while infrared thermography can survey visible areas without sensors and help verify anomalies. IEEE Std 2969-2025 explains that continuous thermal monitoring can supplement or replace periodic infrared inspections where applicable. This depends on equipment and configuration; it does not mean cancelling all inspections.
If an Infrared Image and a Connection Sensor Show Different Temperatures, Which Is Inaccurate?
Different readings do not necessarily mean either method is inaccurate. Check measurement location, timing, load, infrared settings and sensor installation before assessing the cause. Thermography measures an observable surface, whereas a connection sensor measures its installed location. Enclosures, air or insulation between these locations can produce different temperatures.
Where Should Monitoring Start If No Historical Temperature Data Exists?
Begin with equipment supplying critical loads. Select connections such as busbar joints, breaker contacts and incoming or outgoing terminals, and establish a normal baseline under similar load conditions. Subsequent inspection or continuous data can then be compared against that baseline.
Related Reading
- Why Can Electrical Connections Overheat When Data Center Room Temperatures Are Normal?
- Which Data Center Power Distribution Equipment and Hotspots Should Be Monitored?
- Which Power Distribution Equipment and Hotspots Should Data Centers and Semiconductor Fabs Monitor? A Complete Temperature Monitoring Guide